Friends of The Mad River
  • Home
  • Our Impact
    • Community Climate Chats >
      • Past Climate Chats
      • Climate Survey
    • Ridge To River >
      • Action Framework >
        • Programs
        • Research Needs
        • Resources
      • Planning Process >
        • Team
        • Landscape
        • Planning
        • Community
    • Storm Smart >
      • Storm Smart Assessment
      • Storm Smart Resources & FAQs
      • Green Stormwater Infrastructure & Best Management Practices
    • Tree Planting
    • Keeping Water Local
    • Mad River Watch >
      • Highlights from the Field
      • Volunteer Resources
      • Historical Data
    • Flood & Fish Friendly Roads
  • Get Involved
    • Events
    • Volunteer
    • Learn
    • Donate
    • Jobs
  • Who We Are
  • News
  • Contact Us
  • #madshedlove


Landscape

Critical geographic data and research helped us better understand the Mad River watershed, sources of stormwater runoff, its impacts on water quality and resilience, and strategic opportunities for action.

RESEARCH

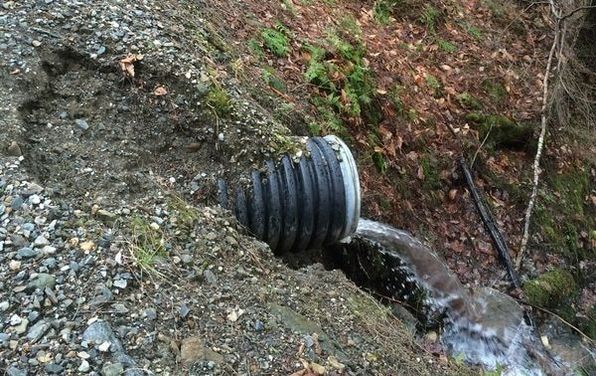
Environmental Report by Stone Environmental 

Between September 2015 and June 2016, the Taskforce worked with Stone Environmental to analyze the watershed’s environmental characteristics in order to identify the sources of stormwater runoff in the Valley. The goal was to identify land uses in the watershed that disproportionately contribute to both stormwater pollutant and sediment load (impacting water quality) and stormwater volume (impacting flood resilience). The report found that private roads and driveways are one of the most significant contributors, and one of the least regulated or managed. Stone Environmental also made recommendations about how Ridge to River could address stormwater management in order to have a positive impact on water quality and flood resilience. 
EXPLORE the STONE Report
Picture

Picture

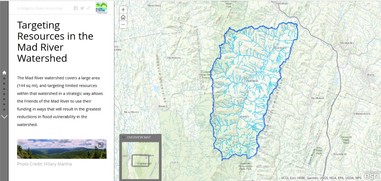
Private Road Prioritization by Watershed Consulting Associates

After learning about the significance of runoff from private roads and driveways in our watershed, we wanted to learn more about where we should focus limited resources. In January 2017, Watershed Consulting Associates helped identify subwatersheds that present the greatest potential threats to water quality due to runoff from private roads. They also identified some of the neighborhoods where people might be having the biggest challenges managing their private drives. 
EXPLORE the WCA Report

KEY FINDINGS

Problematic Roads

Steep, rural roads and driveways present the MRV with a major stormwater challenge

Many Road Miles:
  • The Mad River watershed hosts 437 miles of roads!
  • 1/3 of the total MRV road network consists of roads and driveways that are privately managed ("private drives")
Steep Road Slopes:
  • 40% of MRV private drives are on very steep slopes (>15% slope)
High Road Densities:
  • 1/2 of MRV subwatersheds have road densities high enough (>2.2 km/sq km) that they are associated with increased nutrient and sediment levels, declining habitat quality, and geomorphic instability

Losing Forest

Forest cover strengthens resilience, but we're losing forest cover

Healthy Forest Cover Threshold:
  • ​Research shows that watersheds with <65% forest cover suffer significantly more problems downstream
  • Three MRV subwatersheds fall under this threshold while five others are close & at immediate risk
Declining Forest Cover:
  • Between 2001 & 2011, ~450 acres of MRV forest cover converted to "herbaceous" or "developed" cover

Geographic Priorities

Seven MRV subwatersheds present the greatest risk to water quality & flood resilience

Indicators of Expected Threats:
Nine indicators of expected threats to water quality and resilience (like steep slopes, low forest cover, and high road density) were compiled and analyzed together.
Priority Areas:
  • 7 MRV subwatersheds likely contribute greatly to downstream impacts and are therefore high priorities for action.
  • 54 neighborhoods that share private drives are located in these high priority subwatersheds. Each neighborhood has anywhere from 2 - 119 houses, with 2-3 being most common.

DIG DEEPER

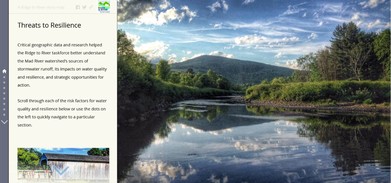
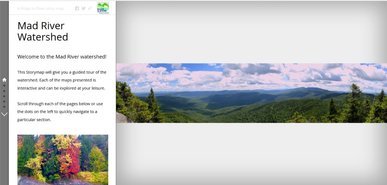
Want to explore the data more deeply? Watershed Consulting Associates built Story Maps from the data in Stone Environmental's report on Landscape & Environmental conditions. Dig in below using these interactive map browsers to learn about the watershed, threats to water quality, and how we hone in on priority areas.
Key Findings from Stone Report

Our Watershed

See the watershed boundaries, learn which subwatershed you call home, and discover land cover types across the Valley.
Picture

Threats to Resilience

Check out spatial data on a variety of threats to the watershed's resilience and water quality, safety and flood control. 
Picture

Targeting Resources

Learn more about the analysis we performed with Watershed Consulting Associates to determine geographic priorities.
Picture
Powered by Create your own unique website with customizable templates.
  • Home
  • Our Impact
    • Community Climate Chats >
      • Past Climate Chats
      • Climate Survey
    • Ridge To River >
      • Action Framework >
        • Programs
        • Research Needs
        • Resources
      • Planning Process >
        • Team
        • Landscape
        • Planning
        • Community
    • Storm Smart >
      • Storm Smart Assessment
      • Storm Smart Resources & FAQs
      • Green Stormwater Infrastructure & Best Management Practices
    • Tree Planting
    • Keeping Water Local
    • Mad River Watch >
      • Highlights from the Field
      • Volunteer Resources
      • Historical Data
    • Flood & Fish Friendly Roads
  • Get Involved
    • Events
    • Volunteer
    • Learn
    • Donate
    • Jobs
  • Who We Are
  • News
  • Contact Us
  • #madshedlove