Field Updates
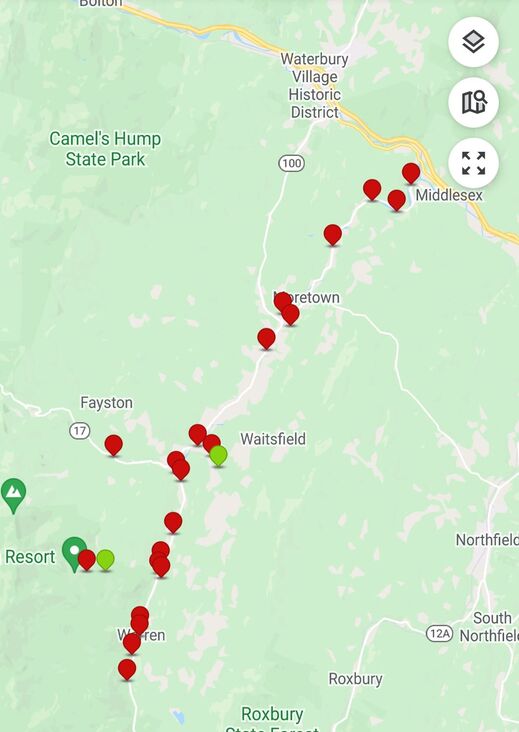
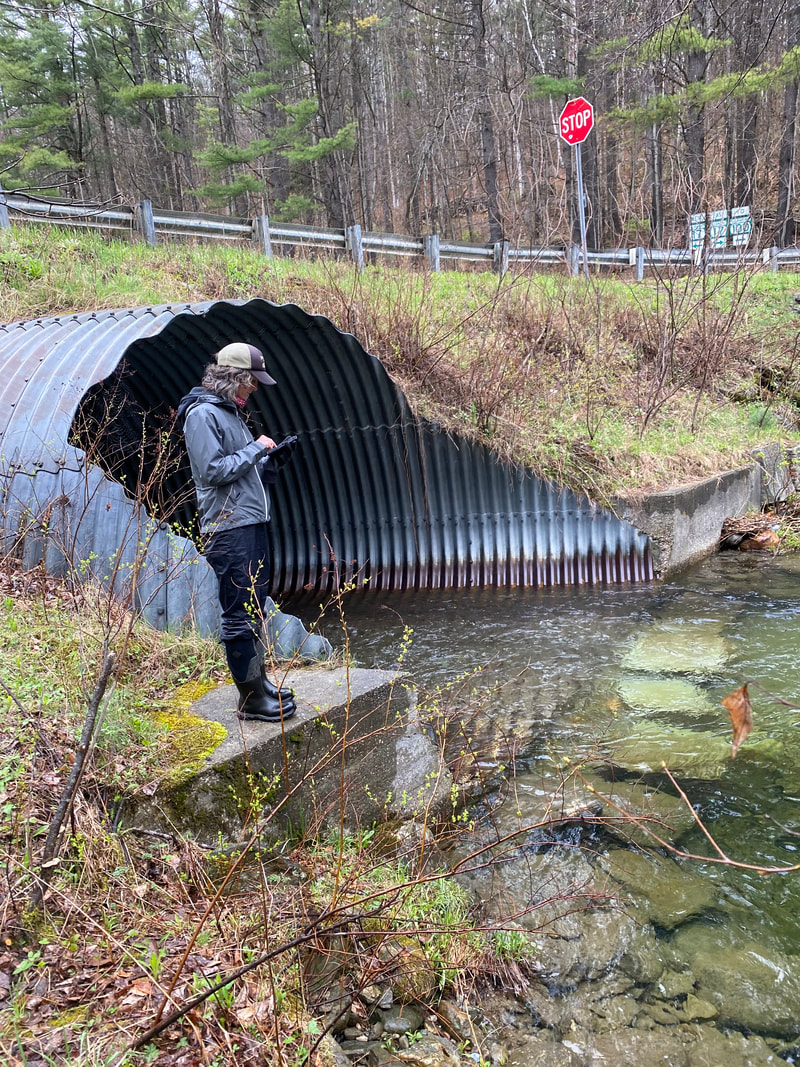
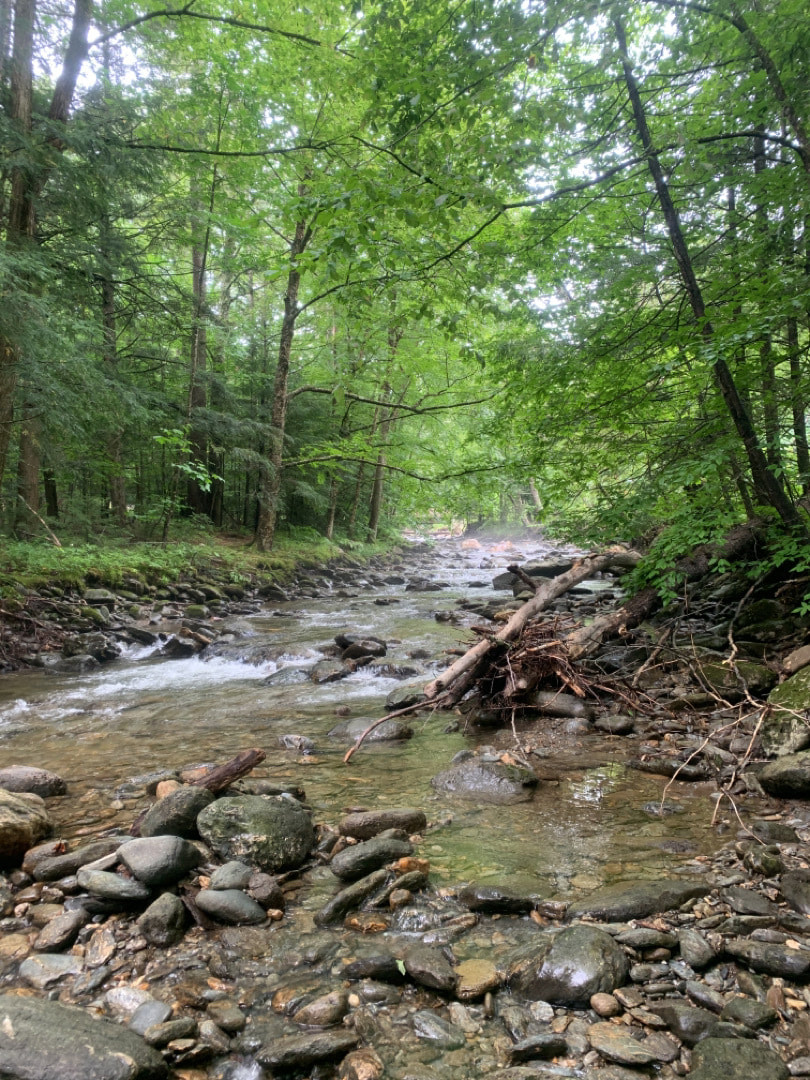
Every two weeks over the course of the field season, Mad River Watch volunteers visit their field sites to make careful observations and to test water quality parameters like temperature, pH, and conductivity. Our volunteers help us understand the health of the watershed and inspire us to deepen our connection to it at the same time.
2021 Highlights from the Field
|
|
|
|
What We Pay Attention to and Why
In 1972, the Clean Water Act was passed with the goal to “restore and maintain the chemical, physical, and biological integrity of the Nation’s waters”. It is in this spirit that the Mad River Watch program seeks to learn more about and protect the Mad River and its tributaries. In addition to these fundamental categories - physical, chemical, and biological - we are also interested in learning more about the way we care for and connect with the watershed around us.
Read on to explore what we are measuring and collecting in 2023 & why:
Read on to explore what we are measuring and collecting in 2023 & why:
PhysicalTemperature influences everything else. It influences bacteria levels and drives all biological activity, makes geochemical reactions happen more quickly, and increases the pace of plant and algae growth. Aquatic life thrives within certain temperature ranges. Knowing the water temperature is a critical element of all of our other monitoring work.
Streamflow lets us get a sense of how much water is moving through the system at any one time. When streamflow is high, lots of water is moving across the land and picks up sediment and pollutants along the way. When streamflow is low, we are getting a picture of the watershed during ‘baseflow’. This variation in the river is a critical context for understanding almost everything else we measure. Erosion & Deposition Rivers are dynamic systems and some degree of erosion and deposition of soil and sediment is normal and good for the integrity of the river ecosystem. However, major storms, human impact, and changes to the landscape can increase erosion to the point where sediment can act as a pollutant and degrade water quality and wildlife habitat. Excess erosion can also lead to increased transportation of other pollutants, like phosphorus, that can have negative impacts downstream. Conductivity (or electrical conductivity) measures the ability of a sample to conduct electricity. Road salt applications across cold regions of the country are linked to increased salinization of freshwater resources, with increasing trends of sodium and chloride. Having this data will enable us to begin to understand how and when components of road salt are moving into the Mad River so we can begin to work on reducing those sources in our effort to protect water quality. ChemicalpH is a measure of the acidity and alkalinity of a solution. The pH scale ranges from 0 to 14 with lower values indicating more acidic conditions and higher values more alkaline. A pH of 7 indicates neutrality which is another way of saying it has a balanced number of hydrogen (H+) and hydroxide (OH-) ions. The pH of natural water bodies is influenced by the bedrock and soils through which it flows.
Human inputs in the form of runoff and pollution can also alter it. Changes in pH can be initiated by pollution and those changes can fundamentally alter a water body's chemistry by changing the biological availability and form of nutrients (such as nitrogen and phosphorus) and metals (like lead, copper, and iron). The most significant and widely impactful cause of acidification of streams in Vermont is from acid rain caused by coal-burning power plants and factories. pH is easy-to-measure and can be used as an early indicator of chemical changes in a water body when collected over time. Phosphorous Nitrogen Chloride BiologicalWildlife Our wild neighbors can tell us a lot about the health of the river and the surrounding land if we are willing to listen. Through observation of animal tracks, signs, and presence, we can start to get an understanding of who else visits our field sites regularly. Over time, these populations might change as a result of a number of factors, from habitat loss (or restoration!) to climate change. Tracking these changes can help inform and prioritize wildlife conservation projects across the Mad River Valley.
Riparian Buffers The stretch of woody plants that runs along the river’s edge is a riparian buffer. Without those buffers, the river is exposed to direct runoff of water and pollutants from the land, more intense erosion along the banks, greater vulnerability to invasive species, and warmer and less oxygenated water. When those buffers are present, they help resolve those issues and provide rich habitat for wildlife. Buffers tend to change slowly over time, although human impact can change them in an afternoon. Our monitoring efforts track changes in these buffers over years and help us identify areas where restoration projects (like invasive species removal and tree plantings) should be prioritized. Invasive and Nuisance Species degrade ecosystems by interrupting or competing with the species that provide habitat and ecosystem services. Some species, like Japanese Knotweed or Honeysuckle, are well established in the Mad River Valley. Keeping an eye on their spread is important and tracking populations can help us adapt as management plans change. Other invasive species have not yet been spotted here but a changing climate and more human impact increases the chance that they spread to the Mad River Valley. Benthic Macroinvertebrates Like wildlife more generally, benthic macroinvertebrates can serve as an indicator for the ecological health of the river. These small aquatic, “bottom-dwelling” animals have limited mobility, meaning they are likely to be exposed to whatever is in the water near them, and changes in the health and population of individual species occur in predictable ways. All together, getting to know these communities of very small wildlife can give us a very big picture of the health of the river. StewardshipHuman Impact By tracking the human use and impact at your field site, you help us develop and prioritize more comprehensive plans that bring others across the community together towards shared stewardship goals, including important partners such as local towns and conservation commissions, for example.
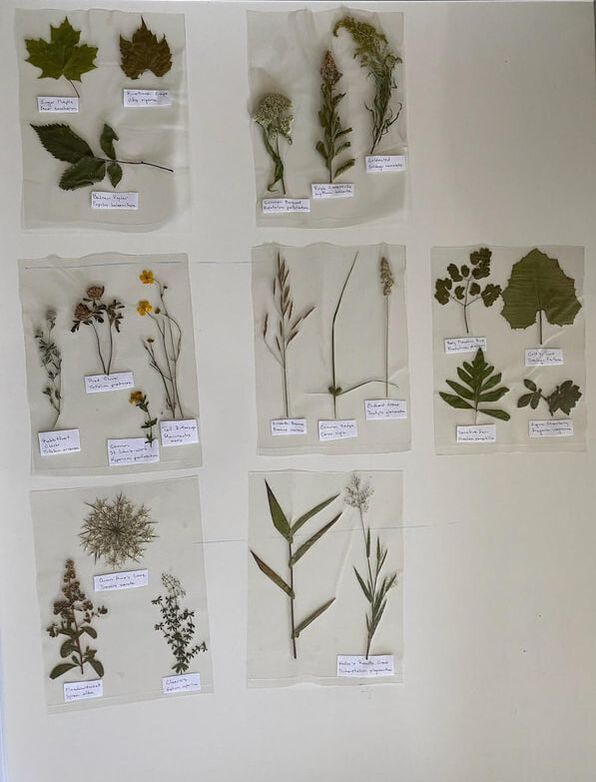
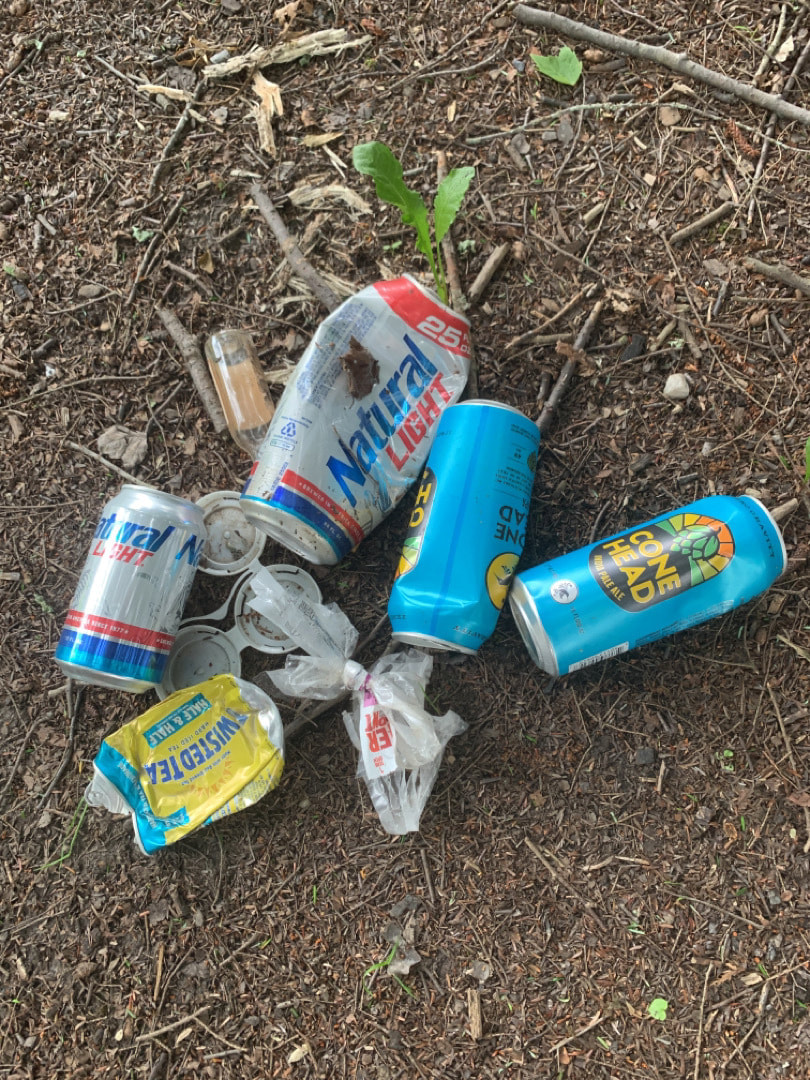
Trash Measuring the volume of trash at your field site can help us plan volunteer stewardship activities and river cleanup events. Identifying the type of trash can help us understand where it is coming from and look upstream to find ways to keep it out of the water in the first place. Stewardship Activities The people that live in the Mad River Valley are part of our local ecosystem and the actions we take as stewards reflect the kind of neighbor we are to both the humans and the wildlife that call this place home. Tracking the work we do as stewards allows us to tell a more complete story about the value and impact of the Mad River Watch program. Connection to PlaceTelling the Mad River Story The story we tell together about the state of the Mad River watershed would not be complete without an exploration of what it really means for us to connect with nature and the river at a personal level. Mad River Watch volunteers are invited to share what they discover and how it makes them feel – to revel in the small natural wonders, investigate their curiosities, sing out the beauty and challenges of their field site, and inspire others.
|

