Friends of The Mad River
  • Home
  • Our Impact
    • Community Climate Chats >
      • Past Climate Chats
      • Climate Survey
    • Ridge To River >
      • Action Framework >
        • Programs
        • Research Needs
        • Resources
      • Planning Process >
        • Team
        • Landscape
        • Planning
        • Community
    • Storm Smart >
      • Storm Smart Assessment
      • Storm Smart Resources & FAQs
      • Green Stormwater Infrastructure & Best Management Practices
    • Tree Planting
    • Keeping Water Local
    • Mad River Watch >
      • Highlights from the Field
      • Volunteer Resources
      • Historical Data
    • Flood & Fish Friendly Roads
  • Get Involved
    • Events
    • Volunteer
    • Learn
    • Donate
    • Jobs
  • Who We Are
  • News
  • Contact Us
  • #madshedlove

The Water Column

Water Temperature; A Measure of the Watershed’s Health

7/27/2021

 
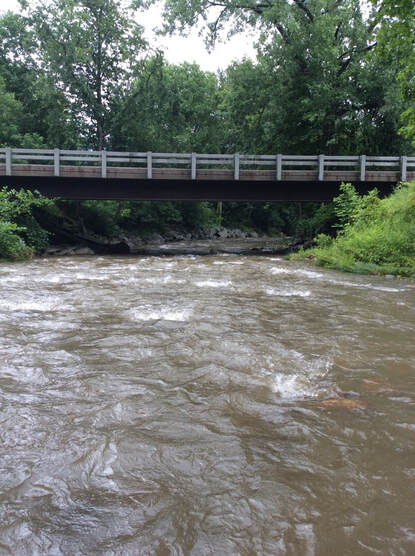
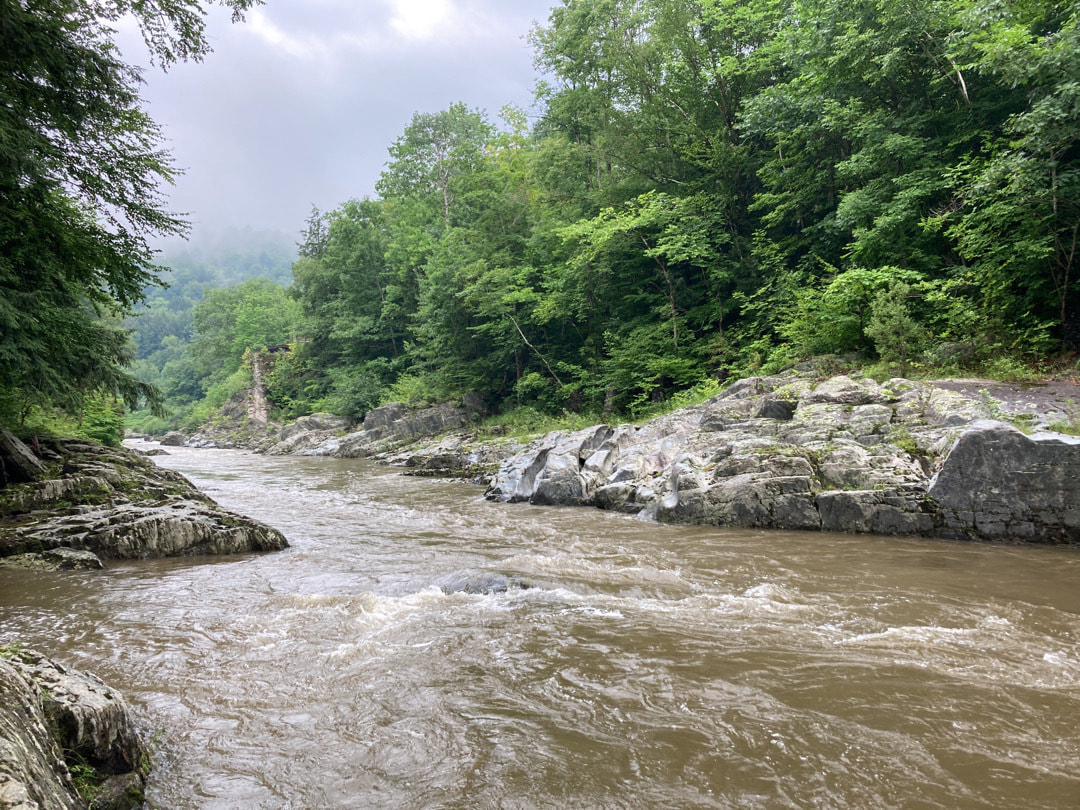
On July 25 and 26, Friends of the Mad River’s (FMR) Mad River Watch volunteers visited field sites across the valley in order to monitor water quality and make detailed environmental observations for their third field exploration this summer. This article is part of a series highlighting the questions and field work driving volunteers to find answers about the health of the Mad River watershed, as well as the community of supporters that make it possible.

Changing Water Temperatures
​

​As part of the reimagined Mad River Watch program, volunteers use a digital handheld probe to record water temperature at their field sites. By distributing field sites up and down the Mad River, as well as in many of the tributaries, differences in temperature provide a baseline for understanding impacts that local topography, land use, and climate change have on the health of the river. Over time, these temperature measurements can be matched with other data sets to provide a fuller picture of changes in the watershed.
 
According to the State of Vermont, in the last fifty years, average air temperature has risen at least 2°F and annual precipitation has increased 7 inches across Vermont. “Tracking temperature and geomorphic changes in our streams, rivers, and lakes is part of understanding climate change at a regional level and the way it may be influencing the plant and animal communities that live here,” explains Friends’ Director Corrie Miller. 
Picture
Hannah Yerks - High flow and turbid waters at Shepard Brook

Impacts on and from the landscape

Recent storms in the valley had severe impacts, washing out Butternut Hill Road in Waitsfield, among other smaller washouts, and disrupting driveways across the region. In addition to impacting the amount of sediment and pollutant loading in a given sub-watershed, variations in the amount and intensity of rainfall, as well as in the location where it lands, impact water temperature directly.
 
“Excess surface runoff in the form of stormwater is warmer when it reaches the stream than water that enters the soil and percolates into the waterways more slowly,” says Becky Tharp of Just Water Consulting. “That warmer surface runoff can heat up the rivers, causing changes to water chemistry and habitat suitability.”
 
Like increased sediment and pollutant loads, elevated water temperature can play a big role in limiting the success of aquatic organisms and govern which species can thrive. “The Mad River is home to a number of cold-water fish species including Brook, Rainbow, and Brown Trout. All of these species prefer cold temperatures, between 52°F and 57°F, with even cooler temperatures needed for spawning,” explains angler and Trout Unlimited board member Clark Amadon.
 
Land use and development, like the presence or lack of a riparian buffer, can also have a significant effect on how much sunlight hits the water. When streamside trees are cut down, there are fewer overhanging branches to provide shade, which leads to more sunlight hitting the stream and warming the water. “Riparian Buffers are important for a number of reasons,” explains Friends’ Stewardship Manager, Ira Shadis. “They provide stability to the bank, a filter to slow runoff and capture pollutants, a sponge to absorb flood water, shade for cold-water species like brook trout, habitat for birds and small mammals, and when strung together with larger blocks of forest, offer critical space for organisms to adjust to environmental stressors and the changing climate.”
 
The impact of different kinds of land use do not always show up directly in the temperature data Friends’ volunteers collect. By combining this data with volunteer’s other observations, targeted inquiries and outreach, and other land use analysis, Friends is able to prioritize projects that address the confluence of water quality, flood resilience, and biodiversity in the watershed.  
Picture
Ilyian Deskov - High flow and turbid waters near the mouth of the Mad River

Highlights from the Field

​Following the recent stormy weather, volunteers saw increased flow and turbidity at their sites. A volunteer at Folsom Brook noted that there was, “evidence of the water being really high at the sampling site. Grass was still bent over from the storm. Maybe 48” above the current water level.” Another volunteer noted the in-stream dynamics near Riverside Park, that the, “water level is high and up over the gravel beach. There is erosion on the upstream gravel island. Water is now flowing through the center of the island.”
 
A volunteer at Shepard Brook took careful notes on the way a nearby tributary and riparian buffer responded to the storm. They noted that, “There is a stream running from the culvert under the driveway that is typically dry. The stream is running through an area of thick vegetation, predominantly ferns, meadow rue, swamp milkweed, jewelweed and other natives on edge of the brook, and bishops weed amongst pine trees closer to the nearby driveway.”
 
This week saw 13 teams of volunteers visit 21 field sites. Water temperatures ranged from a low of 59.2°F at Riverside Park in Warren on Sunday to a high of 64.92°F at the USGS gage in Moretown on Monday. Over the summer, FMR will compile data and observations and share key findings and highlights in the Valley Reporter and online at friendsofthemadriver.org/madriverwatch.

Comments are closed.

    Friends

    of the Mad River

    Archives

    January 2023
    December 2022
    September 2022
    April 2022
    February 2022
    January 2022
    November 2021
    August 2021
    July 2021
    June 2021
    May 2021
    April 2021
    March 2021
    February 2021
    January 2021
    December 2020
    November 2020
    October 2020
    September 2020
    August 2020
    July 2020
    June 2020
    May 2020
    April 2020
    March 2020
    February 2020

    Categories

    All

    RSS Feed

Proudly powered by Weebly
  • Home
  • Our Impact
    • Community Climate Chats >
      • Past Climate Chats
      • Climate Survey
    • Ridge To River >
      • Action Framework >
        • Programs
        • Research Needs
        • Resources
      • Planning Process >
        • Team
        • Landscape
        • Planning
        • Community
    • Storm Smart >
      • Storm Smart Assessment
      • Storm Smart Resources & FAQs
      • Green Stormwater Infrastructure & Best Management Practices
    • Tree Planting
    • Keeping Water Local
    • Mad River Watch >
      • Highlights from the Field
      • Volunteer Resources
      • Historical Data
    • Flood & Fish Friendly Roads
  • Get Involved
    • Events
    • Volunteer
    • Learn
    • Donate
    • Jobs
  • Who We Are
  • News
  • Contact Us
  • #madshedlove